Mouse Model for Tumor Transplantation (TT) ")

Transplanted tumors;TE-1;HepG2;HepG2-luc;SK-MES-1;LL/2-luc-M38
- UOM
- FOB US$ 280.00
- Quantity
Overview
Properties
- Product No.DSI530Mu05
- Organism SpeciesMus musculus (Mouse) Same name, Different species.
- ApplicationsDisease Model
Research use only - Downloadn/a
- Category
- Prototype SpeciesHuman
- SourceInduced by A549-luc intravenous transplantation
- Model Animal StrainsBalb/c-nude Mice(SPF), healthy, male, age: 4~5weeks, body weight:18g~20g.
- Modeling GroupingRandomly divided into six group: Control group, Model group, Positive drug group and Test drug group(low,medium,high).
- Modeling Period4-6 weeks
Sign into your account
Share a new citation as an author
Upload your experimental result
Review

Contact us
Please fill in the blank.
-
 Packages (Simulation)
-
 Packages (Simulation)
-
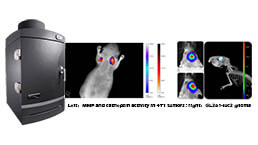
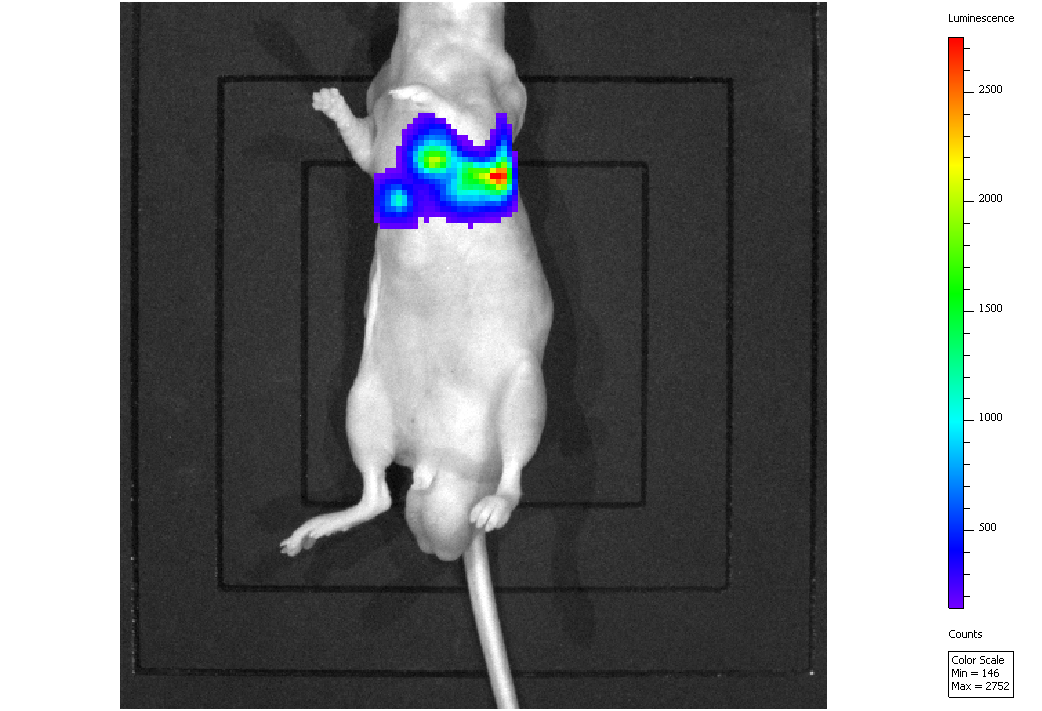 Fig. Fluorescence in vivo imaging after A549-luc cells were injected in situ for 4w
-
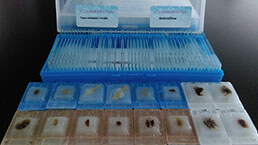
 Fig. The lung of nude mice injected by A549
-
 ISO9001: 2008, ISO13485: 2003 Registered
Modeling Method
Cell line: human lung cancer cell line A549-LUC marked with luciferase gene
Tumor formation by tail vein injection in nude mice: Cells with good growth were digested and prepared into cell suspension. After counting, 100μ L (containing 2*106 cells) of cell suspension was taken and inoculated into nude mice through tail vein. Normal diet was carried out every day.
28 days after injection, in vivo imaging was performed.
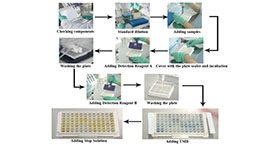
Procedures for imaging small animals in vivo:
Anesthetized mice.
Fluorescence substrate injection: Sodium fluorescein D was injected intraperitoneally, and 15 mg/mL fluorescein working solution was added at the concentration of 10 uL/g. Injection after 10 minutes, began to fluorescence in vivo imaging.
Open the imaging system of small animals in vivo and set the instrument parameters to select a wavelength range of 500-620nm according to the wavelength of the target protein 530-600nm. Select Fluorescent mode, put the mouse into the imaging camera platform, the software controls the platform to rise and fall to a suitable field of view, automatically turn on the light (bright field) to take the first background image. Next, the light was turned off automatically and the specific photons emitted by the mice were photographed in the dark field without external light. Superposition of bright field and dark field background can intuitively display the location and intensity of specific photons in the animal body to complete the imaging operation. It should be noted that appropriate excitation and emission filters should be selected for fluorescence imaging, while bioluminescence needs to be stimulated by substrate injection before imaging.
Model evaluation
28d live imaging, the lungs were imaged visibly;
Pathological results
Cytokines level
Statistical analysis
SPSS software is used for statistical analysis, measurement data to mean ± standard deviation (x ±s), using t test and single factor analysis of variance for group comparison , P<0.05 indicates there was a significant difference, P<0.01 indicates there are very significant differences.
Giveaways
Increment services
-
 Tissue/Sections Customized Service
-
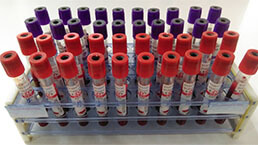 Serums Customized Service
-
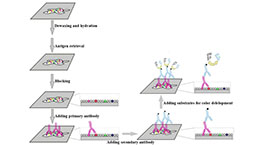 Immunohistochemistry (IHC) Experiment Service
-
 Small Animal In Vivo Imaging Experiment Service
-
 Small Animal Micro CT Imaging Experiment Service
-
 Small Animal MRI Imaging Experiment Service
-
 Small Animal Ultrasound Imaging Experiment Service
-
 Transmission Electron Microscopy (TEM) Experiment Service
-
 Scanning Electron Microscope (SEM) Experiment Service
-
 Learning and Memory Behavioral Experiment Service
-
 Anxiety and Depression Behavioral Experiment Service
-
 Drug Addiction Behavioral Experiment Service
-
 Pain Behavioral Experiment Service
-
 Neuropsychiatric Disorder Behavioral Experiment Service
-
 Fatigue Behavioral Experiment Service
-
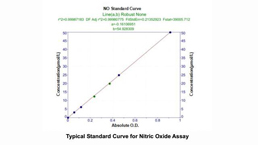
 Nitric Oxide Assay Kit (A012)
-
 Nitric Oxide Assay Kit (A013-2)
-
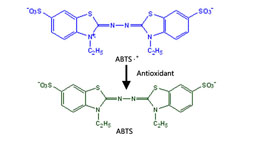 Total Anti-Oxidative Capability Assay Kit(A015-2)
-
 Total Anti-Oxidative Capability Assay Kit (A015-1)
-
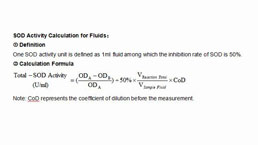 Superoxide Dismutase Assay Kit
-
 Fructose Assay Kit (A085)
-
 Citric Acid Assay Kit (A128 )
-
 Catalase Assay Kit
-
 Malondialdehyde Assay Kit
-
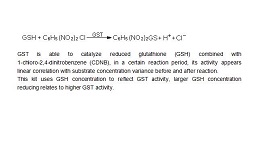 Glutathione S-Transferase Assay Kit
-
 Microscale Reduced Glutathione assay kit
-
 Glutathione Reductase Activity Coefficient Assay Kit
-
 Angiotensin Converting Enzyme Kit
-
 Glutathione Peroxidase (GSH-PX) Assay Kit
-
 Cloud-Clone Multiplex assay kits