Mouse Model for Tumor Transplantation (TT) ")

Transplanted tumors;TE-1;HepG2;HepG2-luc;SK-MES-1;LL/2-luc-M38
- UOM
- FOB US$ 220.00
- Quantity
Overview
Properties
- Product No.DSI530Mu01
- Organism SpeciesMus musculus (Mouse) Same name, Different species.
- ApplicationsTE-1 transplanted tumor cells model
Research use only - Downloadn/a
- Category
- Prototype SpeciesHuman
- Sourceinduced by TE-1 transplanted tumor cells
- Model Animal StrainsBalb/c Nude Mice(SPF), healthy, male, age: 4~5weeks, bodyweight:15g~18g.
- Modeling GroupingRandomly divided into six group: Control group, Model group, Positive drug group and Test drug group (three doses), n=15.
- Modeling Period3W
Sign into your account
Share a new citation as an author
Upload your experimental result
Review

Contact us
Please fill in the blank.
-
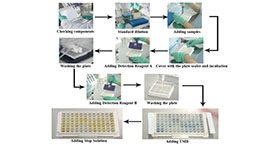
 Packages (Simulation)
-
 Packages (Simulation)
-
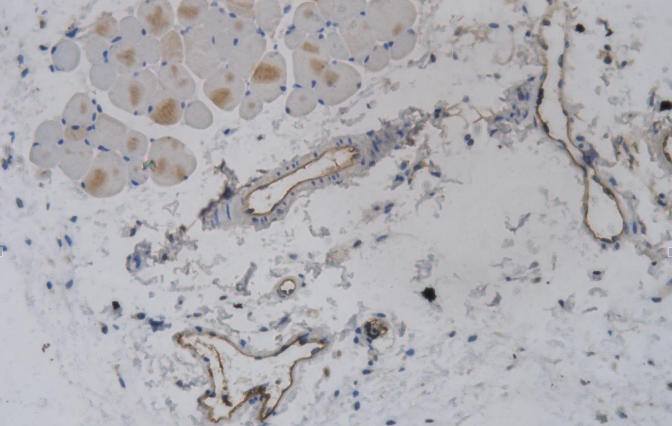 Fig 2. CD31 immunohistochemical staining in tumor tissue of model group (X200).
-
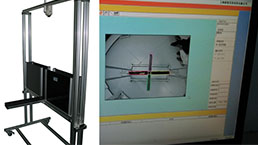
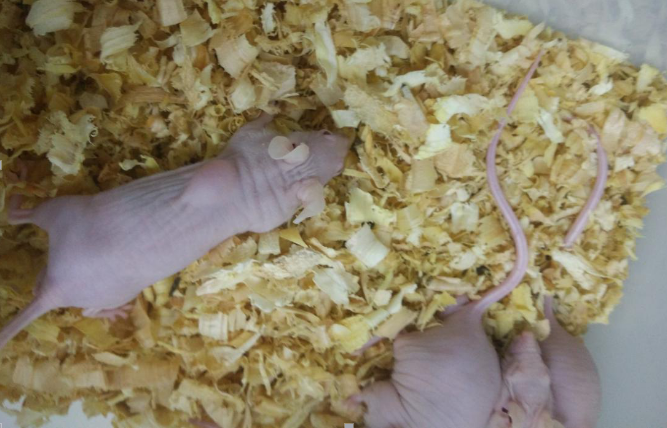 Fig 1. Transplanting TE-1 tumor cells into nude mice
-
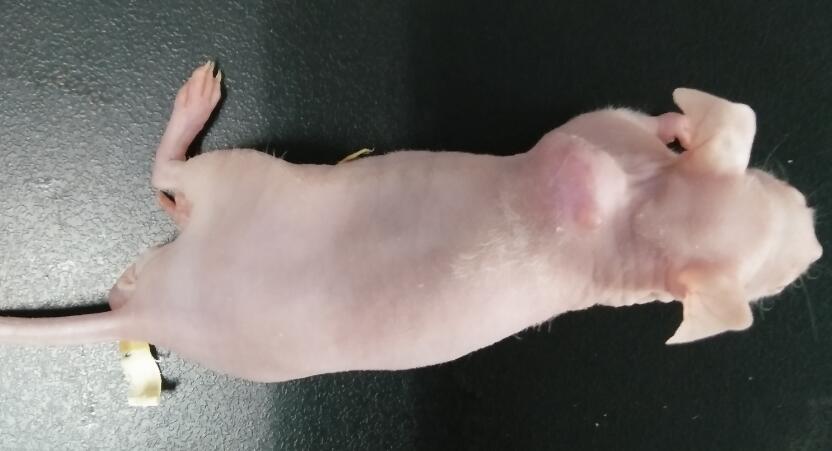 Fig 4. TE-1 tumor formation on the nude mice
-
 ISO9001: 2008, ISO13485: 2003 Registered
Modeling Method
1.Collect the logarithmic growth phase of esophageal cancer cell line( TE-1), wash with PBS, a total of 5 * l07 cell suspension per milliliter, inoculated subcutaneously in nude mice subcutaneous (0.2 ml/per mice) and then feed in the SPF environment.
2. Regular observation of tumor growth in nude mice, and use vernier caliper to measure the tumor size and draw the tumor growth curve.
3. About 21 days, mice were sacrificed and the tumor tissue removed in l0% formalin fixed, paraffin embedded sections, conventional HE staining and immunohistochemical staining.
Model evaluation
1. Cancer tumor growth:
To observe the changes in tumor growth and build tumor growth curve: the size of tumor was measured 2 times per week, the tumor volume was calculated according to the formula, V=Π/6[(A+B)/2]^3 (A, B respectively for tumors of the long diameter and short diameter.
Pathological results
2. HE staining:
The tumor cells become false palisading, oval, irregular shape, cytoplasm stained red or violet red nucleus in violet or purple red, irregularly shaped, oval, unequal in size, clear membrane, chromatin with unequal thickness and deep staining. The tumor cells were arranged densely, unequal in size, uniform distribution of patchy; tumor tissue showed visible focal necrosis, visible cell debris and debris, a small amount of inflammatory cell infiltration, tumor and normal tissue but no clear demarcation, capsule formation.
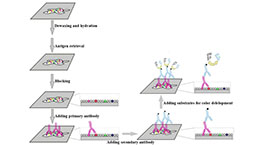
3. VEGF and CD31 immunohistochemical staining:
VEGF-C and CD31 promote angiogenesis in angiogenesis. Immunohistochemistry results showed that VEGF-C and CD31 positive cells and positive vessels were expressed in tumor tissues
Cytokines level
4. Fluorescent quantitative PCR (Q-PCR) detection:
Take control of oesophagus and tumorigenic mouse tumor to make the Q-PCR detection, detection index: VEGF-C, Lymphatic vessel endothelial hyaluronan receptor 1(LYVE-1), GAPDH as reference.
Statistical analysis
SPSS software is used for statistical analysis, measurement data to mean ± standard deviation (x ±s), using t test and single factor analysis of variance for group comparison , P<0.05 indicates there was a significant difference, P<0.01 indicates there are very significant differences.
Giveaways
Increment services
-
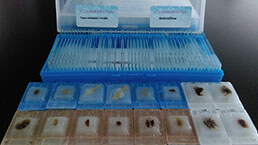 Tissue/Sections Customized Service
-
 Serums Customized Service
-
 Immunohistochemistry (IHC) Experiment Service
-
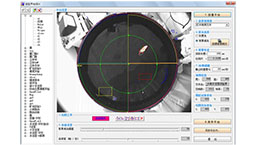
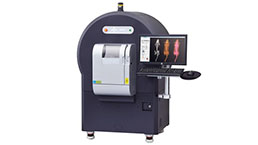 Small Animal Micro CT Imaging Experiment Service
-
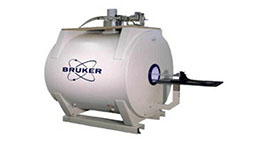 Small Animal MRI Imaging Experiment Service
-
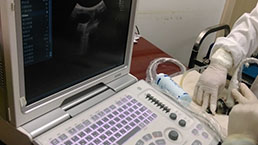 Small Animal Ultrasound Imaging Experiment Service
-
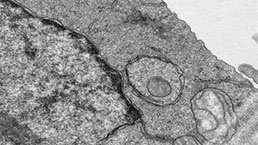 Transmission Electron Microscopy (TEM) Experiment Service
-
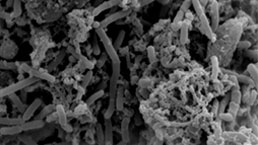 Scanning Electron Microscope (SEM) Experiment Service
-
 Learning and Memory Behavioral Experiment Service
-
 Anxiety and Depression Behavioral Experiment Service
-
 Drug Addiction Behavioral Experiment Service
-
 Pain Behavioral Experiment Service
-
 Neuropsychiatric Disorder Behavioral Experiment Service
-
 Fatigue Behavioral Experiment Service
-
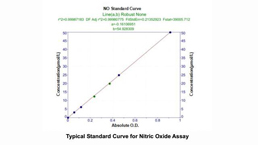
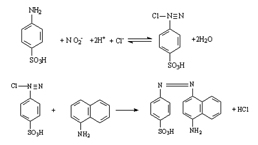 Nitric Oxide Assay Kit (A012)
-
 Nitric Oxide Assay Kit (A013-2)
-
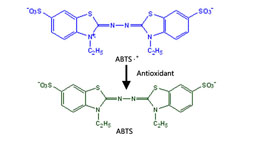 Total Anti-Oxidative Capability Assay Kit(A015-2)
-
 Total Anti-Oxidative Capability Assay Kit (A015-1)
-
 Superoxide Dismutase Assay Kit
-
 Fructose Assay Kit (A085)
-
 Citric Acid Assay Kit (A128 )
-
 Catalase Assay Kit
-
 Malondialdehyde Assay Kit
-
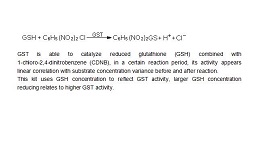 Glutathione S-Transferase Assay Kit
-
 Microscale Reduced Glutathione assay kit
-
 Glutathione Reductase Activity Coefficient Assay Kit
-
 Angiotensin Converting Enzyme Kit
-
 Glutathione Peroxidase (GSH-PX) Assay Kit
-
 Cloud-Clone Multiplex assay kits